[Update] 분석보드 - 데이터 세분화 기능 출시
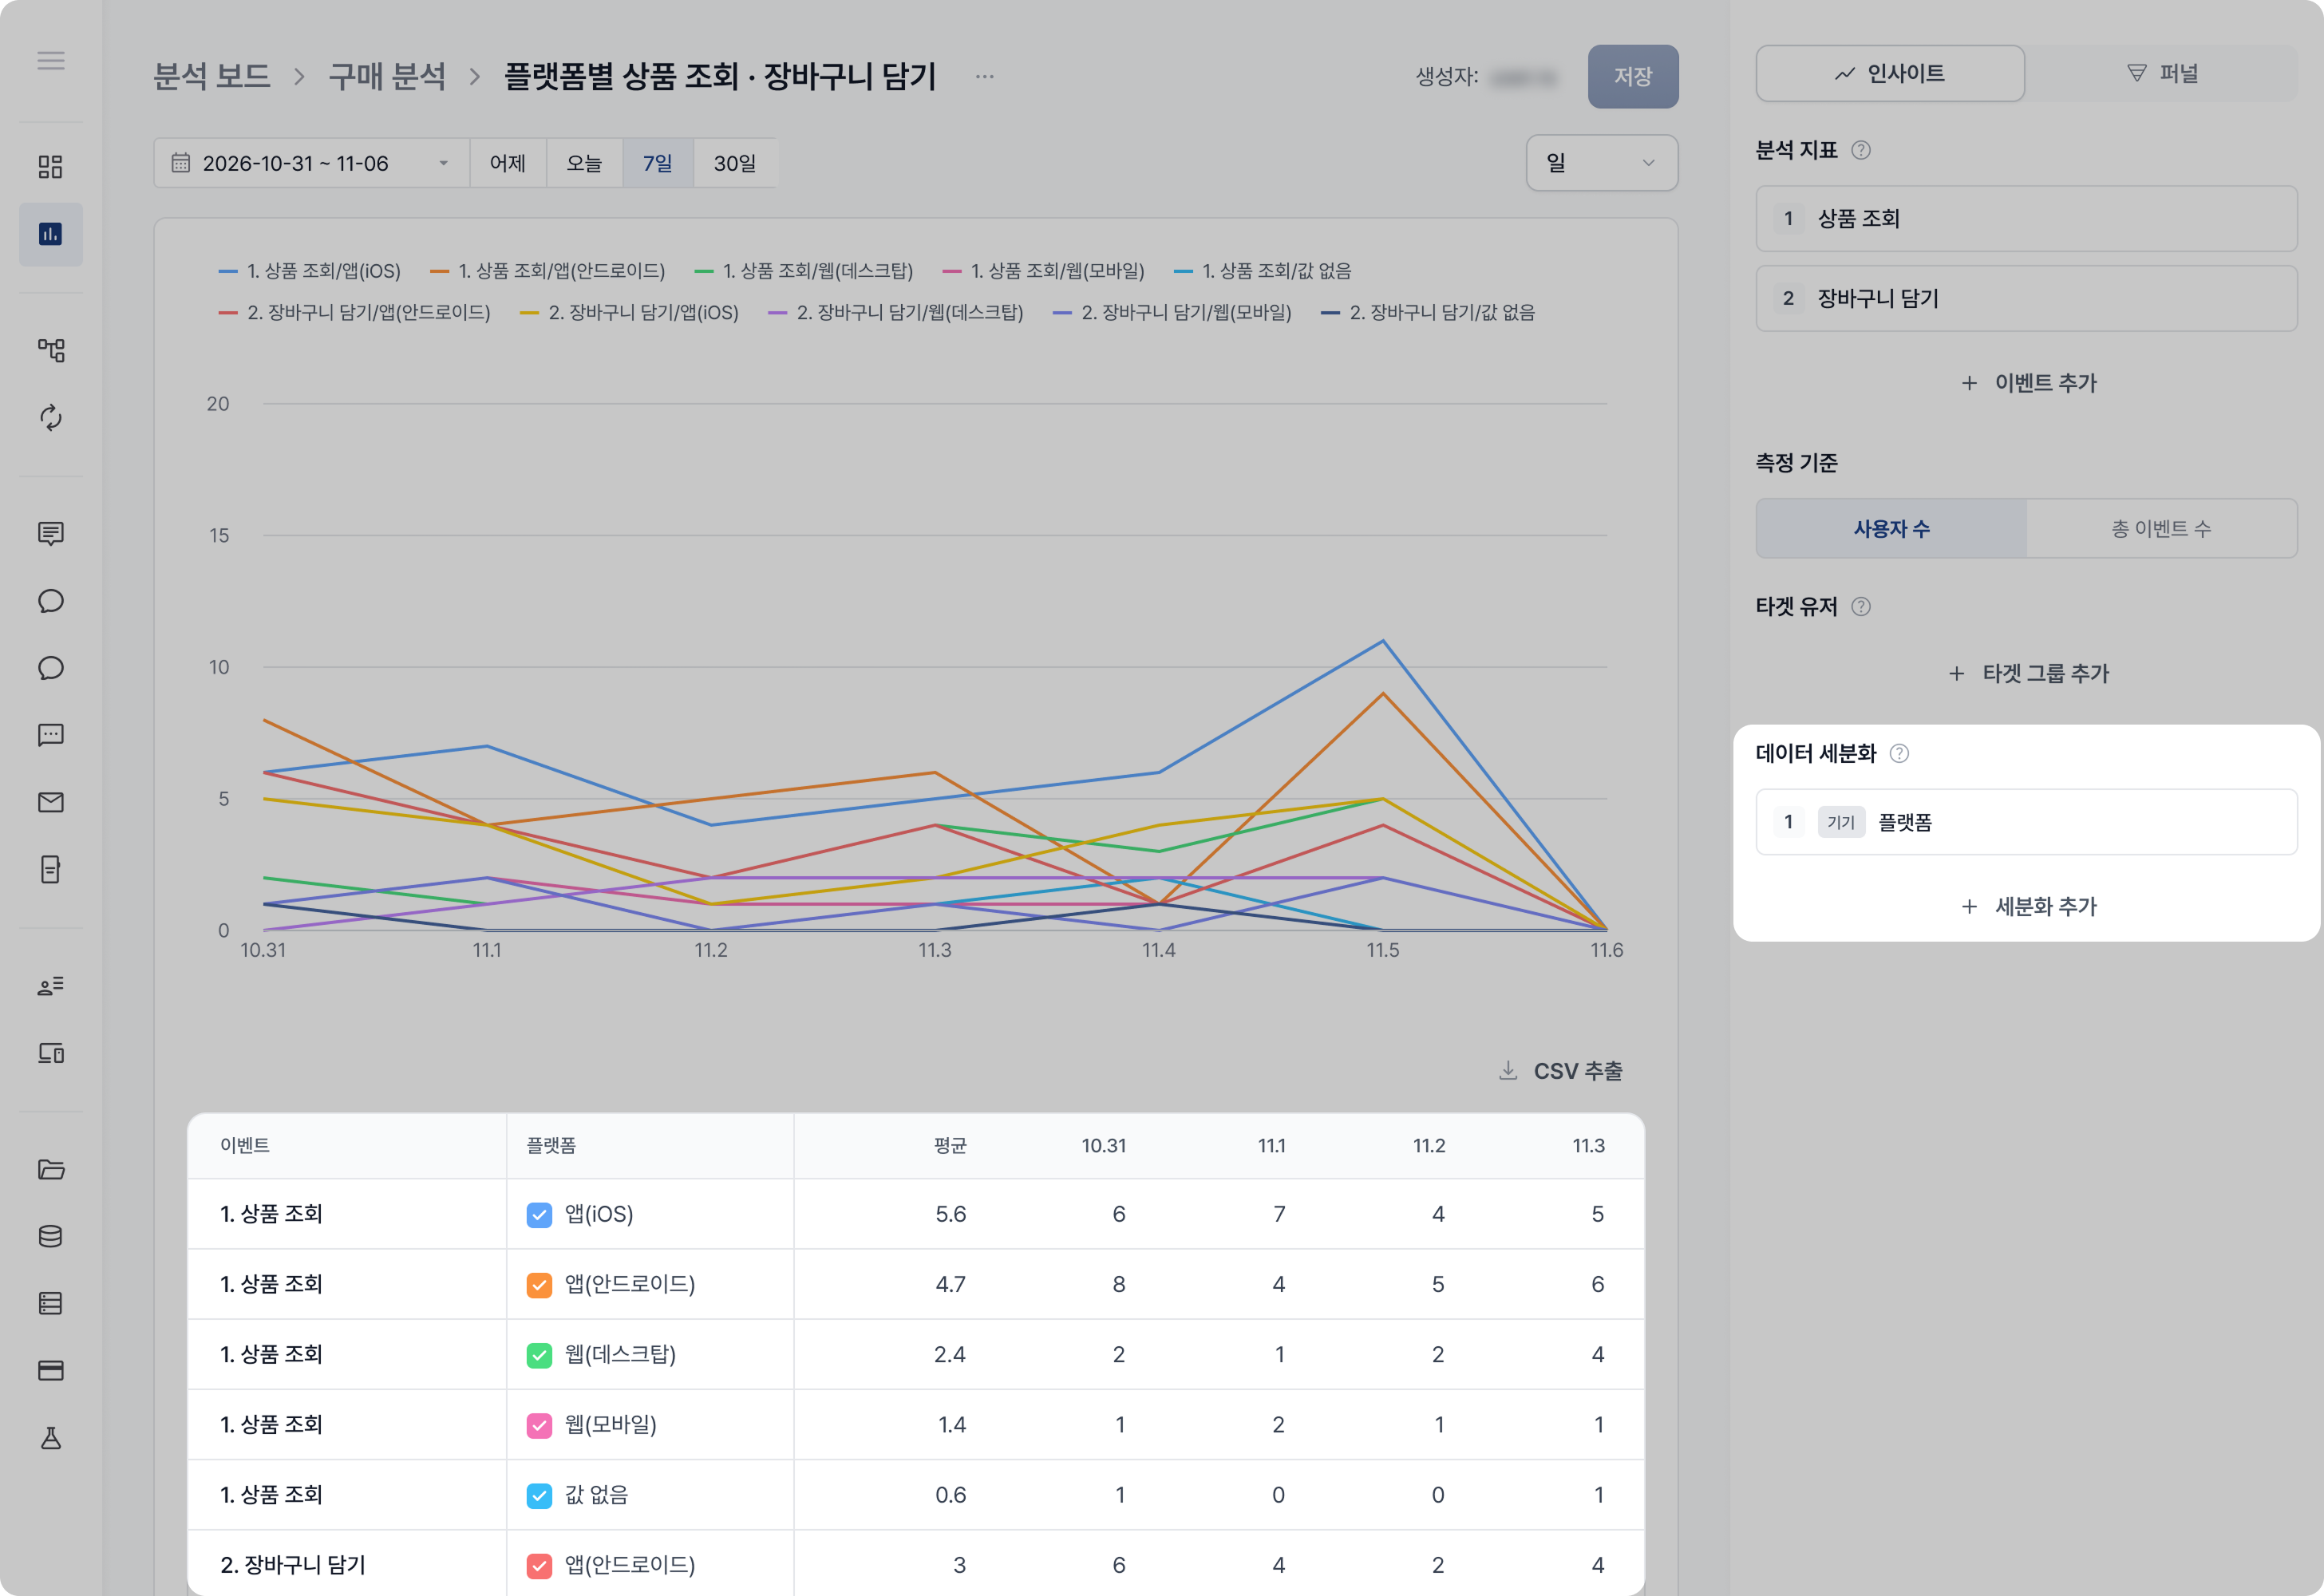
분석보드에 데이터 세분화 기능이 출시되었습니다. 🎉
하나의 통계에서 세그먼트, 유저·기기 속성 및 태그를 기준으로 데이터를 세분화하고, 표와 그래프를 통해 기준별 지표 차이를 한눈에 비교할 수 있습니다.
이를 통해, 동일한 통계를 여러 개 만들 필요 없이 다양한 기준에 따른 데이터를 한 번에 확인할 수 있습니다.
활용 예시:
플랫폼(iOS / Android / Web)별 푸시 클릭 추이 비교
세그먼트 포함 / 미포함 유저 간 전환율 비교
국가별 앱 실행 수 비교
더 자세한 내용은 [유저 가이드→] 를 확인해주세요!
The Split by feature is now available in the Analytics Dashboard! 🎉
You can split data within a single report by segments, user and device attributes, and tags, then compare metrics across different criteria at a glance using tables and charts.
This eliminates the need to create multiple reports, allowing you to explore and compare data across various criteria in one place.
Use Cases:
Compare push click trends across platforms (iOS / Android / Web)
Compare conversion rates between users included in and excluded from a segment
Compare app launches by country
For more details, check out the [User Guide →]